Stats
The Stats view.
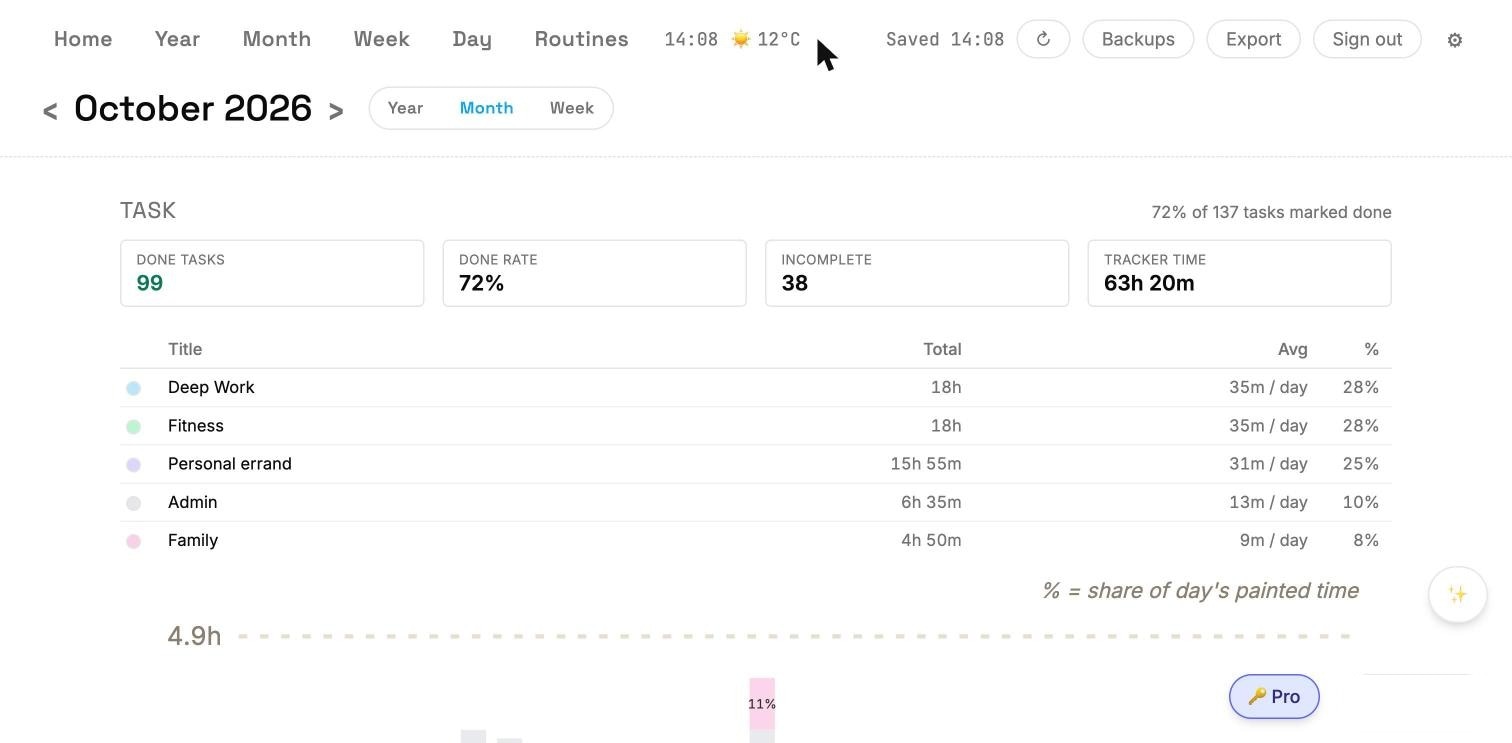
Stats is a single scrollable page that summarizes a chosen period across four dimensions — Task, Routine, Mood, and Sleep. There is nothing to configure; Cumulus builds every chart from the data you already entered. The screenshots below show a filled-in October 2026: 137 tasks, 4 routines, mood tracked 21 of 31 days, sleep tracked 17 days.
Period selector
- < / > arrows — step one period back or forward.
- Date label (e.g. October 2026) — click to jump to today's period.
- Year / Month / Week toggle — switches the whole page between the three periods.
Month is the default. Changing periods recomputes everything client-side.
1. Task
A four-card header, a category breakdown table, and a stacked daily chart.
- Done tasks — in the example, 99 of 137.
- Done rate — 72%.
- Incomplete — 38 still open at month end.
- Tracker time — 63h 20m total painted on the Rhythm timeline.
The breakdown table splits the painted time by category: Deep Work 18h (28%), Fitness 18h (28%), Personal errand 15h 55m (25%), Admin 6h 35m (10%), Family 4h 50m (8%). The stacked bar chart below uses the same colors; each bar is one day, stacked by category, with inline % labels where a segment is tall enough to carry one.
2. Routine
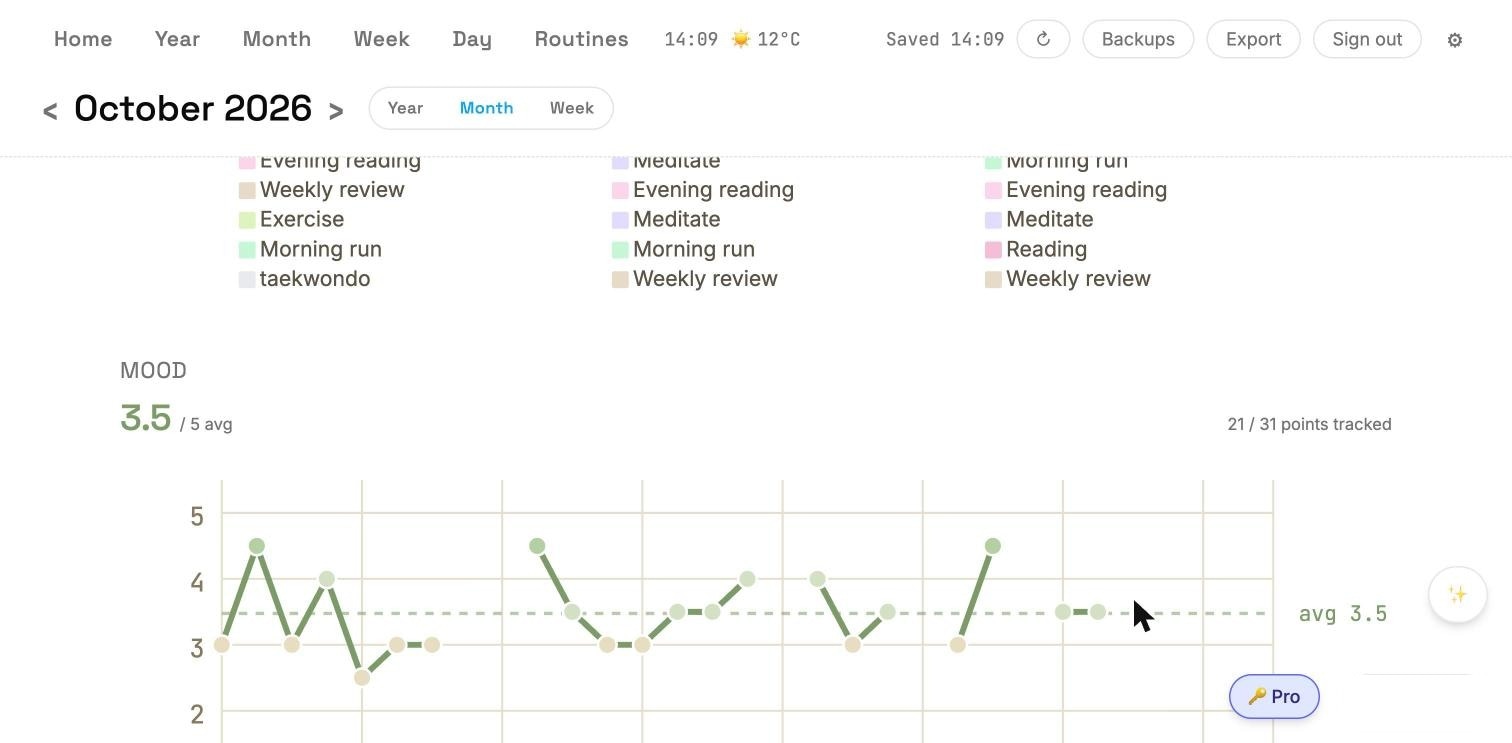
How many of the period's scheduled routine-days you actually completed. The chart stacks each routine's completion by day, with 100% labels where the routine was logged. Legend below names each routine — in the example: Evening reading, Meditate, Morning run, Weekly review.
Routine stats are month-only; Week and Year views don't carry per-routine detail.
3. Mood
A dot chart over the period's days, mapping the mood you logged in the Day view's Thoughts tab to a 1-5 scale. In the example the headline reads 3.5 / 5 avg with 21 / 31 points tracked and an avg line at 3.5 across the chart.
- 5 — Energized
- 4 — Good
- 3 — Steady
- 2 — Tired
- 1 — Drained
Days with no mood entry leave a gap. The legend at the bottom of the chart doubles as the color key.
4. Sleep
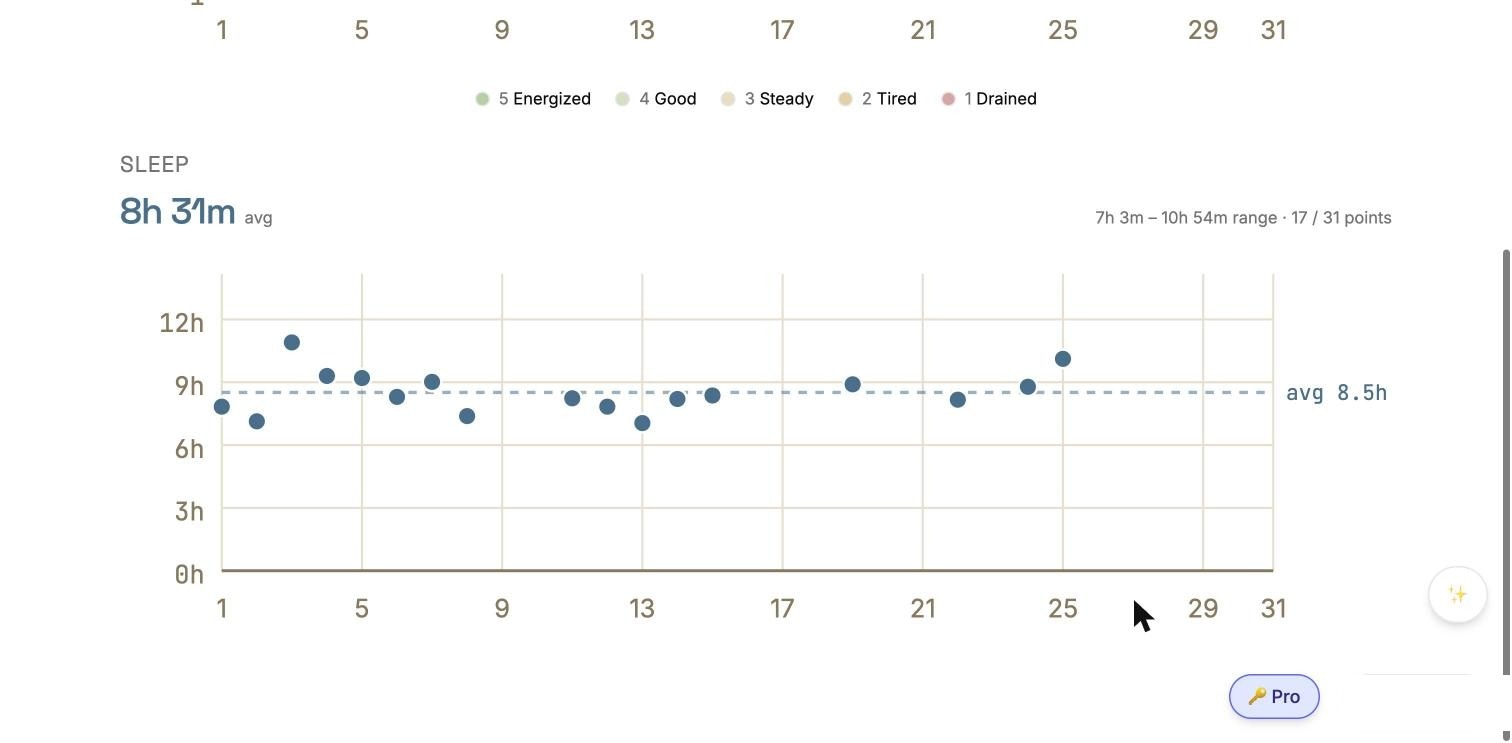
A dot chart of the hours you logged on each day's Thoughts tab, with a rolling avg line. In the example: 8h 31m avg, range 7h 3m – 10h 54m, 17 / 31 points. Days without a sleep entry show as a gap, not as zero — Cumulus never guesses a zero where you didn't log anything. When nothing is logged for the period, the chart reads "No sleep recorded this period" instead of an empty frame.
Year, Month, Week — what changes
- Year — x-axis is 12 months. Mood and Sleep collapse to monthly averages.
- Month — x-axis is 1-31. Each bar is one day.
- Week — x-axis is 7 days. Detail per bar is higher.